Let Istar help you get started on your project with our experience and know-how!
Upload your design files and production requirements and we will get back to you within 30 minutes!

Have you ever thought about why a rubber band snaps back into place, but a paperclip stays bent? Or why some things stretch a lot before they break, while other things snap right away? I used to think about these questions too. Well, there is a special chart that shows us exactly how things act when you pull them. It’s called a stress-strain curve, and it’s one of the most important ideas in the mechanics of materials.
This article will be your map. We will look at what a stress-strain curve is. We will learn how to read it. And we will see what it tells us about everyday objects. You will find out why engineers think these stress–strain curves are so useful. They use them to build everything from bridges to airplanes. By the end, you will be able to look at a simple graphical chart and learn about the secret strong and weak points hidden within the material.
To get the stress-strain curve, we first need to know about its two main parts. These parts are stress and strain. They might sound hard, but they are really simple. Picture yourself in a tug-of-war with a rope. The pull you are using on the rope makes a force inside it. This force is called stress. To be exact, stress is defined as the amount of force put on something, spread over its area. Think of it as how much “pressure” the material feels on the inside. So, a bigger pull on the same rope means more stress.
Now, what is happening to the rope as you pull on it? It is stretching! That stretch is called strain. Strain tells us how much something changes its shape because of the stress. If the rope gets a little bit longer, it has a little bit of strain. If it stretches a lot, it has a lot of strain. So, you can think of stress and strain as a team. One causes the other. You apply stress (the pull), and you get strain (the stretch).
If you understand how stress and strain work together, you can understand a lot about a material. This teamwork is exactly what the stress-strain curve shows us. When we pull on something, we call it tensile stress. When we squash something, we call it compressive stress. For our map, we will mostly talk about pulling things.
So, how do people make these helpful charts? They use a special machine to do a tensile test. Imagine you take a piece of a material. It is often shaped like a dog bone. You put it into a testing machine. This machine has strong clamps that hold on to each end of the material. Then, the testing machine slowly starts to pull the material apart. This is a uniaxial pull. That just means it pulls in one single, straight line.
As the testing machine pulls with more and more force at room temperature, it measures two things at the same time:
The machine puts these points on a chart. It puts stress going up and down, and strain going from side to side. The line that gets drawn is the famous stress-strain curve! Just one test gives us tons of information. It tells us all about the mechanical properties of that piece of engineering materials.
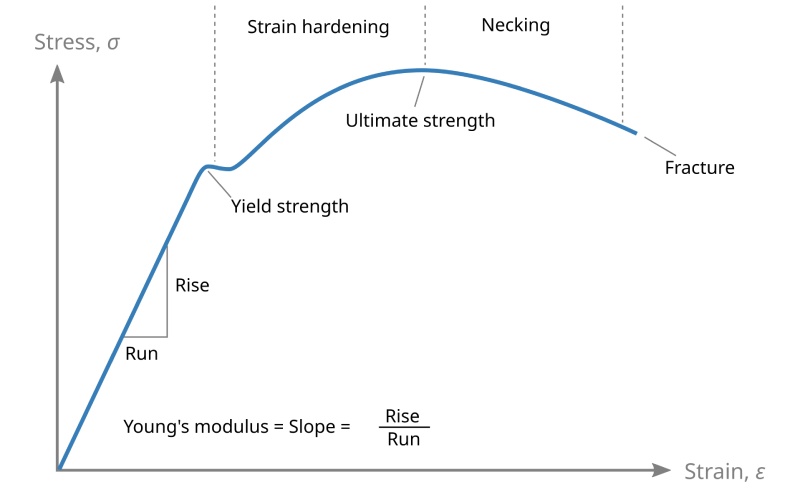
When you first look at a typical stress-strain curve for a metal, you will see the curve starts with a line that is perfectly straight. It goes up and to the right. We call this straight part the linear elastic area. What does that mean? It means the material acts just like a new rubber band. When you pull on it, it stretches. When you let go, it goes right back to its first shape. We call this elastic action. The material has not been changed for good.
In this part of the curve, stress is proportional to strain. This is a famous rule in science. If you make the stress two times bigger, you make the strain two times bigger. This perfect teamwork keeps going until it gets to a special spot. This spot is called the proportional limit. The line is completely straight all the way to this proportional point. It is a very simple part of the story. It shows the material’s first signs of elasticity. This straight line is called the linear portion of the curve.
This portion of the curve is a big deal for engineers. They want to make things that stay within the elastic limit. This is for things we use every day. For example, you do not want a bridge to stay bent after a truck drives over it! The proportional limit is the spot where the stress-strain relationship stops being a straight line. Just after that is the elastic limit. This is the very last point where the material can spring back to its original shape when you let go.
The first part of the stress-strain curve is a straight line. Every straight line has a slope. That slope has a special name. It is called the Modulus of Elasticity. Sometimes it is called Young’s Modulus. I know, that sounds fancy. But it is just a number. It tells us how stiff a material is. A stiff material, like steel, will have a slope that is very steep. This means you need a lot of stress to get just a little bit of strain.
Think about it this way: it is very hard to stretch a steel bar. That is because its modulus of elasticity is a very big number. On the other hand, a material like rubber has a slope that is not very steep on its strain curve. You do not need much stress to get a whole lot of strain. That is why rubber is so stretchy! So, the modulus is just the stress divided by the strain in that elastic area. The modulus of elasticity is a key property. It helps engineers pick the right material for a job.
| Material | Stiffness (Modulus) | Looks and Feels Like |
|---|---|---|
| Steel | Very High | A stiff metal ruler |
| Aluminum | High | A soda can |
| Plastic | Low | A plastic water bottle |
| Rubber | Very Low | A rubber band |
We find this number, the modulus, by figuring out the slope of the straight, linear part of the curve. It is a very important way to measure the material’s elasticity.
If we keep pulling on our material past the elastic limit, something different happens. The stress-strain curve is not straight anymore. It starts to bend. This is the spot called the yield point. The yield point is a key spot on our chart. This is the point where the material stops being elastic. It starts to change forever. We call this plastic deformation.
Think about bending a paperclip. You can bend it a little bit, and it will go back to its shape (that is elastic). But if you bend it too far, it stays bent. You have gone past its yield point. You are now in the area of plastic deformation. The amount of stress you need to get to this point is called the yield strength or yield stress. Once you go past the yield strength, the material will have a permanent deformation. This happens even after you stop pulling. You have changed it forever!
For some things, like soft steel, the yield point is very easy to see. The curve might even go down a little bit. This means the material all of a sudden starts to stretch a lot. You do not even need to add much more force. This happens because very small parts inside the metal start to move around. This is the start of a permanent strain. To induce plastic deformation just means you have to use enough stress to go past this point.
This is a very interesting part of the story. After the material starts to change for good (past the yield stress), you might think it is just getting weaker. But for lots of materials, like a metal, the stress-strain curve starts to go up again! This means the material is really getting stronger as it changes shape. This cool feature is called strain hardening.
So what is going on inside? As the material is stretched, all the little bits inside get mixed up and tangled. This tangle makes it more difficult for them to move. So, you need to apply more and more stress to keep it stretching. We call this part of the chart the strain hardening region. The material gets tougher. This happens due to strain hardening.
Have you ever bent a wire back and forth? You probably saw that it gets harder to bend each time. That’s strain hardening in action! You are making the metal stronger, but you are also making it less stretchy. This is how the material fights against more changes. This is where deformation takes place. The stress increases as the strain increases in this area.
As we keep pulling and the material keeps getting harder, the stress-strain curve keeps going up. It finally gets to a peak. This is the highest point on the whole curve. This peak is called the ultimate tensile strength (UTS). This is the biggest amount of engineering stress the material can take. After this point, it starts to get weaker.
The ultimate tensile strength is a very important number. It tells you the biggest pulling force a material can survive. If you use a stress that is higher than the UTS, the material is going to break. It is the king of the hill on the stress-strain curve. Any stress value past this point means the material will soon break.
You can think of it as the material’s last big moment. It stretched. It got harder through strain hardening. And now it is at its strongest point. From this point on, things start to go down. This leads to the final break, which is called a fracture. The ultimate stress is very important information. Engineers need it to design strong parts.
After getting to the top point, the ultimate tensile strength, something odd starts to happen. The stress-strain curve starts to point down. But wait, how can the stress go down while we are still pulling on it? This is because of something we call necking.
When the material is close to breaking, one little spot starts to get skinny. It looks like a neck is forming. The cross-sectional area in the neck gets smaller. Because it is smaller, it cannot hold as much force. The pull is now all in that one small area. So the actual stress inside the neck is still going up! We call this true stress. But the machine is measuring the force based on the first cross-sectional area. So, the stress it calculates seems to go down. This is the engineering stress.
This necking region shows that the material is not stable anymore. All the stretching now happens in that one small neck area. The necking begins right after the UTS is reached. The necking process keeps going. The cross-section gets smaller and smaller. Then, the material finally breaks.
The end of the stress-strain curve is the fracture point. This is where the material finally breaks into two pieces. For a ductile material, like many metals, this fracture happens after a lot of stretching and a lot of necking. If you look at the broken pieces of a ductile material, you will often see a shape called a “cup and cone” fracture. One side looks like a cup, and the other looks like a cone. This is a clear sign of this kind of break.
The whole area under the stress-strain curve tells us about the material’s toughness. Toughness is a way to measure how much energy something can take in before it breaks. Something with a high ultimate tensile strength that also stretches a lot is very tough. Its curve will have a large area under it. It can handle a lot of energy before it breaks. This is a very good feature for many jobs.
The trip we see on the stress-strain curve, from the first elastic stretch to the final fracture, gives us a full picture of the properties of a material. It tells us its strength, its stiffness, and how well it can soak up energy. The area under the stress-strain curve shows the amount of strain energy that is soaked up per unit volume.
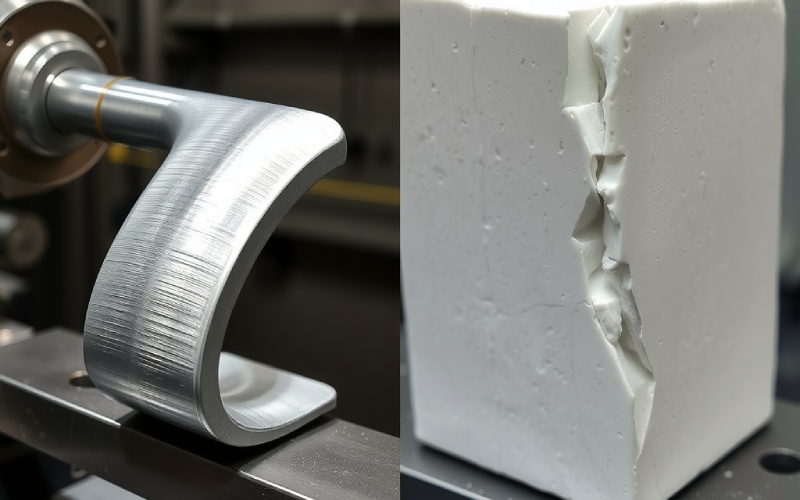
Not all stress-strain curves look the same. Really, the shape of the curve is like a fingerprint for a material. It tells you if the material is ductile or brittle. Like we saw, a ductile material (like steel or copper) has a long stress-strain curve. It stretches a lot. It also shows a clear yield point, strain hardening, and necking before it breaks.
But brittle materials (like glass or ceramics) have a very different type of stress-strain curve. Their curve is very short and steep. A brittle material shows almost zero plastic deformation. It stretches a tiny bit in the elastic area, and then it just snaps! There is no warning. There is no yield point. And there is no necking. This is why a glass shatters right away when you drop it.
So, an engineer can look at the shape of a stress-strain curve and know a lot about how that material will act. For the case of ductile materials, the break is slow. But brittle materials have a break that is fast and sudden. The original stress-strain curve tells the whole story. We can also look at true stress and true strain. This gives us a better picture, especially in the necking region. It fixes the numbers for the changing cross-sectional area. The engineering strain and normal strain are easier ways to measure. They use the starting length.