Let Istar help you get started on your project with our experience and know-how!
Upload your design files and production requirements and we will get back to you within 30 minutes!

The iron-carbon phase diagram seemed like a really complicated drawing with confusing lines and strange words. But this diagram is a very important guide for people like me who work with metals. It helps us figure out how steel and cast iron get their special features. In this article, I will break down this chart so it is easy to follow. You will find out what it is and why it is so important. You will also learn how to use it. This will help you see how a simple ingredient like carbon can turn iron into lots of helpful materials.
The iron-carbon phase diagram is a special kind of graph. It shows us what happens to iron when we add a small amount of carbon. It also shows how things change when we adjust the temperature. You can think of it as a recipe book for making iron and steel. The diagram tells us which “phase,” or form, the iron-carbon mix will be in. This depends on the temperature and the amount of carbon. These forms have different qualities. Some forms are soft and can bend easily. Other forms are very hard and strong.
A scientist by the name of Sir William Chandler Roberts-Austen made this important diagram. He used a special tool that he invented to check the temperature of melted iron. This diagram is a picture that shows the different forms that iron and carbon can make. These forms appear under certain temperatures and with certain amounts of carbon. The chart shows temperature on the line that goes up and down (the Y-axis). It shows the amount of carbon on the line that goes from side to side (the X-axis). By looking at this chart, we can guess what the inside structure of an iron-carbon mix will look like. This helps us understand its qualities.
This diagram is very important for making and treating steel and cast iron. It helps us create many different kinds of steel for many different uses. The iron-carbon phase diagram has helped make things strong and safe, from the cars we use to the buildings we live in. It is a basic and important guide for engineers and metal experts. It helps them understand how the amount of carbon and the heating process affect the final material.
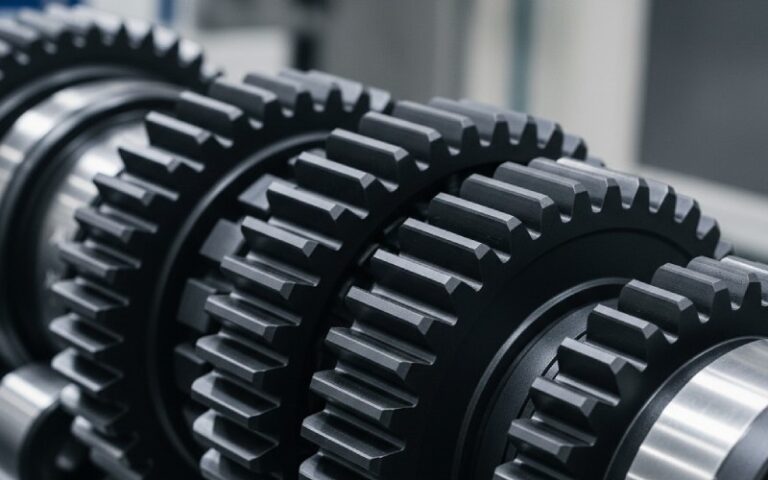
The iron-carbon phase diagram is very important for anyone who works with steel. It acts like a map that shows us how to get the features we need in our steel. Steel is a mix of iron and carbon. We can change how strong it is, how hard it is, and how much it can bend. We do this by changing the amount of carbon and by changing how we heat and cool the steel. The diagram shows us exactly what will happen to the steel’s structure on the inside, which we call its microstructure. This structure changes at different temperatures and with different carbon levels.
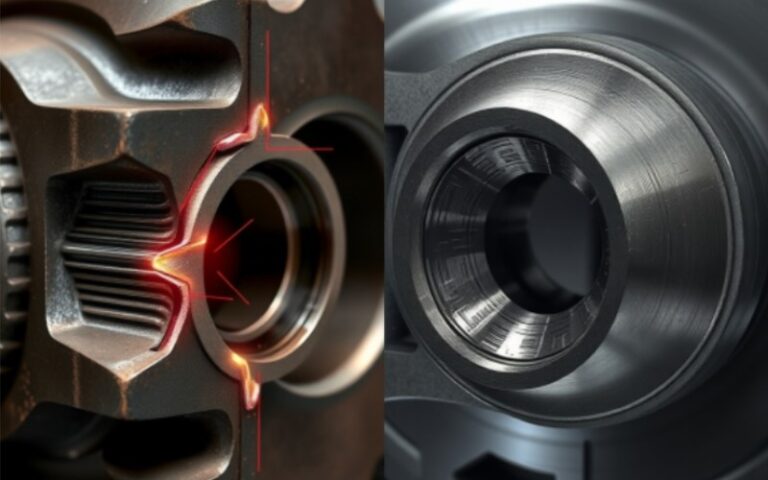
I have used this diagram many, many times to fix issues when making steel products. For example, if a part is cracking or snapping too easily, I can look at the diagram. It helps me see if we need to change how we heat and cool it. It also shows if we need to change the amount of carbon to make the part tougher. The diagram helps us guess and control the forms that are in the mix. This is very important because the forms decide how the steel will act. For instance, we can try to get a certain amount of a form called austenite or pearlite. This will give us the right strength and toughness.
The diagram is also a key part of making new kinds of steel. By understanding how temperature, carbon amount, and the final forms are connected, we can create new mixes. These new mixes have special features for new uses. It helps us control how fast we cool the steel to get certain inside structures, like pearlite or martensite. This control over the heating and cooling processes is what lets us make everything from very strong tool steels to bendy car parts.
When you look at the iron-carbon phase diagram, you will see different areas on the chart. These areas show the different forms of the iron-carbon mix. A phase is a part of the material that is the same all the way through. The most important forms you should know about are ferrite, austenite, and cementite.
There are also mixes of these forms that have their own names. One is called pearlite. Pearlite is made of thin layers of ferrite and cementite. Understanding these different forms and how they are made is the first step to knowing the power of the iron-carbon phase diagram.
The amount of carbon in an iron-carbon mix greatly changes how the mix behaves. Even a very small change in the amount of carbon can make a big difference. The iron-carbon phase diagram clearly shows how the inside structure changes as we add more carbon. In general, as the amount of carbon increases, the mix gets harder and stronger. But, it also breaks more easily.
Let’s look at the different kinds of iron-carbon mixes based on how much carbon they have:
The iron-carbon phase diagram is our guide to understanding these different kinds of steel and cast iron. It helps us pick the right mix of ingredients for the job.

On the iron-carbon phase diagram, there are a few special spots on the chart where cool things happen. One of the most important spots is the eutectic point. A eutectic reaction is a special change. This is when a liquid metal turns into two different solids all at once. This happens at one specific temperature. For the iron-carbon mix, this happens at a temperature of 1147°C and with 4.3% carbon.
Picture a liquid iron-carbon mix with exactly 4.3% carbon that is cooling down. When it gets to 1147°C, it doesn’t just freeze into one solid thing over time. Instead, it suddenly becomes a mix of two solids. These solids are austenite and cementite. This special mix that forms at the eutectic point is called ledeburite. Mixes with this amount of carbon are known as eutectic alloys.
There is another important spot on the diagram called the eutectoid point. A eutectoid reaction is similar to a eutectic reaction. But, it all happens when the metal is already solid. One solid form changes into two new solid forms. In the iron-carbon diagram, this takes place at 727°C with 0.76% carbon. At this point, the solid austenite form changes into a mix of ferrite and cementite. This mix is called pearlite because it looks a bit like a pearl. The eutectoid reaction is very important for the heating and cooling of many kinds of steel.
When you look at the iron-carbon phase diagram, you will see several areas, or “phase fields.” These areas are marked with the names of the forms that are present in that range of material mix and temperature. In some areas, there is only one kind of solid. In other areas, there is a mix of two solids.
The areas with only one form are where you will find just ferrite, just austenite, or just cementite. You will always find areas with two forms in between the areas with one form. For example, between the ferrite and austenite areas, there is a field marked “ferrite + austenite.” This means that at any temperature and carbon level in that area, the mix will be made of those two forms.
Here is a simple way to think about it. Imagine you have steel with 0.5% carbon. You heat it up to 900°C. The diagram tells you that you will be in the austenite area. This means the whole piece of steel will be in the austenite form. Now, if you slowly cool that same steel down to 650°C, the diagram shows you will be in the “ferrite + cementite” area. This tells us that the austenite has changed into a mix of ferrite and cementite. The chart is a very helpful guide. It lets us know which forms will be in the mix at any temperature.
The iron-carbon phase diagram is a very important tool for figuring out and managing the heat treatment of steel. Heat treatment is when we heat and cool a metal to change how it behaves. By using the diagram, we can plan ways to heat and cool steel to make it harder, softer, or tougher.
Let’s use a common heating process called normalizing as an example. To normalize a piece of steel, we first heat it. We heat it to a temperature where it changes all the way into the austenite form. The iron-carbon diagram shows us the exact temperature we need. This temperature depends on the amount of carbon in the steel. This temperature is above an important line on the chart called the A3 line.
After the steel is completely in the austenite form, we then let it cool in the air. As the steel gets cooler, the austenite changes into other forms. The diagram helps us guess what those forms will be. For many kinds of steel, the austenite will change into pearlite with very small pieces. Pearlite is a mix of ferrite and cementite. This process makes the steel both strong and able to bend. Other heating and cooling processes also use the changes shown in the iron-carbon phase diagram. These include annealing (which is slow cooling) and quenching (which is very fast cooling). These processes help us get the results we want. For instance, very fast cooling, or quenching, can create a very hard form that breaks easily, called martensite. Martensite is not shown on this diagram because it is a form that is not fully stable.
The qualities of each form in the iron-carbon diagram come from its crystal structure. The crystal structure is the special way its atoms are lined up in a pattern that repeats. The three main forms—ferrite, austenite, and cementite—each have a different crystal structure. This is why they have such different qualities.
The change from one crystal structure to another is what lets us change the steel’s qualities through heat treatment. This happens as the steel is heated and cooled. The iron-carbon phase diagram is our map for understanding these changes.

As you look at the iron-carbon phase diagram, you will see many key lines and spots. One of the most important temperatures is shown as a flat line going across at 727°C (or 1341°F). This is often called the A1 temperature or the eutectoid temperature. The A1 line shows the temperature where the eutectoid reaction happens.
Below the A1 line, austenite cannot exist. So, if you have a piece of steel in the austenite form and you cool it slowly below 727°C, the austenite will change. It will turn into pearlite, which is a mix of ferrite and cementite. This change happens at this temperature for steels that have between 0.022% and 2.14% carbon.
There are other key dividing lines on the diagram too. For example, the A3 line shows the temperature where ferrite starts to form from austenite. This happens when cooling a steel with less than 0.76% carbon (hypoeutectoid steel). This temperature changes based on the amount of carbon. For steels with more than 0.76% carbon (hypereutectoid steel), the line that shows where cementite starts to form from austenite is called the Acm line. The A1 line is a very important point to look at for many heating processes. This is because it shows the bottom edge of the area where austenite can be found.
For a metal expert like me, the iron-carbon phase diagram is one of our most important tools. It is a basic part of our work with metals and materials engineering. We use it every day to understand, create, and manage the qualities of steel and other iron mixes.
Here are a few ways I use the diagram in my job:
To put it simply, the iron-carbon phase diagram is a useful and helpful tool. It gives us the basic information that lets us create the wide variety of iron and steel materials that are so important in our world today.